LaTeX 中怎么用 tikz 包画框图
Published:
tikz 包
包的引用
\usepackage{tikz}   % tikz矢量图包%
\usepackage{tikz-network}
\usetikzlibrary{positioning, shapes.geometric, fit, calc, arrows.meta}
\usetikzlibrary{chains,scopes, backgrounds,shapes, shadows, quotes}
可能要用到的设置
\tikzset{%
  >={Latex[width=2mm,length=2mm]},
  % Specifications for style of nodes:
            base/.style = {rectangle, rounded corners, draw=black,
                           minimum width=4cm, minimum height=1cm,
                           text centered, font=\sffamily},
  activityStarts/.style = {base, fill=blue!30},
       startstop/.style = {base, fill=red!30},
    activityRuns/.style = {base, fill=green!30},
         process/.style = {base, minimum width=2.5cm, fill=orange!15,
                           font=\ttfamily},
}
\tikzset{
  meta box/.style = {draw, black, very thick, text centered},
  punkt/.style={meta box, rectangle, rounded corners, inner sep=5pt, minimum height=2em, minimum width=6em, align=center, text width=6em},
  round box/.style={meta box, circle},
  every fit/.style={draw, thick, dashed, gray, inner sep=10pt}
}
画图
网络结点图
代码
\begin{figure}[htbp]
    \centering
    \begin{tikzpicture}
        % 画结点
        \Vertex[x = 1.5, y = 3, size = 0.3, label = A]{A}
        \Vertex[x = 0, y = 1.8, size = 0.3, label = B]{B}
        \Vertex[x = 0.6, y = 0.3, size = 0.3, label = C]{C}
        \Vertex[x = 2.4, y = 0.3, size = 0.3, label = D]{D}
        \Vertex[x = 3, y = 1.8, size = 0.3, label = E]{E}
        % 画边
        \Edge(A)(B)
        \Edge(A)(C)
        \Edge(A)(D)
        \Edge(D)(B)
        \Edge[color = red](E)(B)
        \Edge(C)(D)
        \Edge(D)(E)
        % 文本标注
        \node at(0.3,2.4){0.2};\node at(0.8,2.1){-0.5};\node at(0.3,1.3){0.3};
        \node at(2.6,2.1){0.8};\node at(3.1,1.3){-0.8};
    \end{tikzpicture}
    \caption{Network}
    \label{fig:network}
\end{figure}
效果图
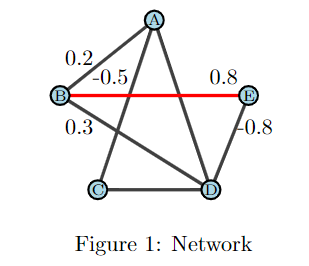
提示
\Vertex命令中,label表示结点内的标注,花括号里的内容是结点的名称- 这里
x, y的默认单位是pt
曲线图
代码
\begin{figure}[htbp]
    \centering
    \begin{tikzpicture}[scale=0.5]
        % 设置坐标
        \draw[->](-1,0)--(0,0)node[below right]{$0$}--(10,0)node[below]{$x$};
        \draw[->](0,-3.5)--(0,5)node[left]{$y$};
        % 画两个曲线的函数图像
        \draw[domain=0:8, very thick]plot(\x,{sqrt(\x)});
        \draw[domain=-1:8, very thick]plot(\x,{3*sin(\x*70)});
        % 给函数添加标签
        \node at(7,-2) {Function 1};
        \node at(10,3.5) {Function 2};
    \end{tikzpicture}
    \caption{Function Image}
    \label{fig:function}
\end{figure}
效果图
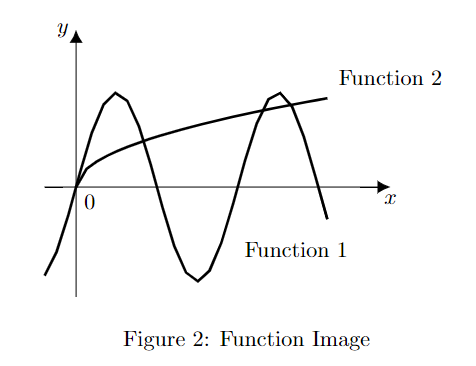
提示
- 核心函数是
plot{x,y},这里x用\x表示,y是一个用花括号括起来的\x的相关函数。- 注意函数的表示和 latex 公式中的不一样,举例来说,不是
\sqrt{},而是sqrt()
- 注意函数的表示和 latex 公式中的不一样,举例来说,不是
- 曲线有些僵硬,这个我还不会改
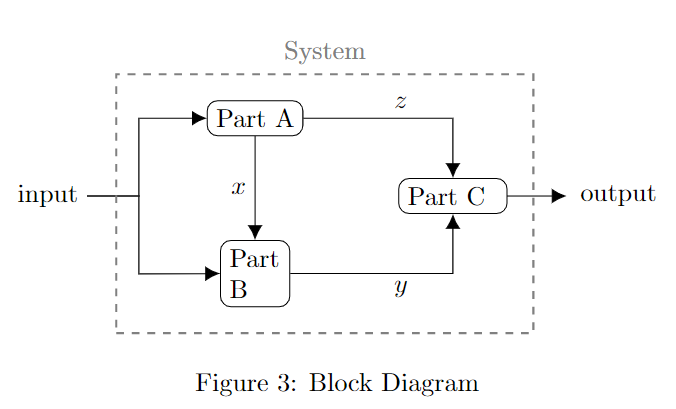
框图
代码
\begin{figure}[htbp]
    \centering
    \begin{tikzpicture}
        % 画方框
        \node[draw, rounded corners, opacity=0, text opacity=1] at (0,0) (input) {input};
        \node[draw, rounded corners] at (80pt,30pt) (parta) {Part A};
        \node[draw, rounded corners, below = 40pt of parta, text width = 20pt] (partb) {Part B};
        \node[draw, rounded corners, right=120pt of input, text width=35pt] (partc) {Part C};
        \node[draw, opacity=0, text opacity=1] at (220pt,0) {output};
        \node[draw, opacity=0, text opacity=0] at (40pt,0) (empty){ };
        % 画箭头
        \draw[->] (input.east) -- ++(20pt,0) -- ++(0,30pt) -- (parta.west);
        \draw[->] (input.east) -- ++(20pt,0) -- ++(0,-30pt) -- (partb.west);
        \draw[->] (parta) -- node[left] {$x$} (partb);
        \draw[->] (partb)-| node[yshift=-6pt,xshift=20pt, text width=3cm] {$y$} (partc);
        \draw[->] (parta)-| node[yshift=6pt,xshift=20pt, text width=3cm] {$z$} (partc);
        \draw[->] (partc) -- (200pt,0);
        % 画虚线框
        \node[ fit= (empty) (parta) (partb) (partc), label={[gray, anchor=south]north: System}] {};
    \end{tikzpicture}
    \caption{Block Diagram}
    \label{pic:bd}
\end{figure}
效果图